Blog Post 4 - Deliverable 4#
Reflections on Phase 3 feedback#
The Phase 3 feedback, particularly as our project starts to look like a real product, really helped guide us towards a further refined MVP, and forced us to consider the rationale behind each feature of our app. Reflecting on that feedback, we’ve decided to keep the requirement that posts come with a graph, as we want to enforce the idea that data should back all policy posts, and while other forms of data—such as tables or simple statistics—would be cool, we really value the interactivity of a plot on each post, and a user’s ability to open that plot in the data playground and explore it. We’ve also improved the data playground to make it more streamlined and less “busy.” Lastly, we’ve added meaningful differentiation to every user persona.
Beyond revisions from Phase 3 feedback, in Phase 4, we’ve been grinding to get a cohesive product and MVP with most of our proposed features. Our key updates since our presentation include:
- Adding pages such as expanding a post, an about page, a saved graphs page, and a make post page
- Reworking the data playground and other pages’ UIs to be more streamlined and intuitive
- Creating routes for expanded posts, making posts, adding questions or answers, adding expert feedback, and predicting our second model
- Differentiating using personas through different pages and different ways of interacting with a post for different users
- Creating, training, cross-validating, and tweaking our Deep Neural Network to get the best prediction results
ML Models#
DS Side
We developed three machine learning models. Logistic, Linear, and a Deep Neural Network. We utilized the Logistic and Linear model to predict the GINI Index score. We decided to deploy the Logistic regression model into our software architecture, because it would not break our data playground since the outputs of logistic regression are bounded between 0 and 1.
Our Deep Neural Network model was utilized to predict unemployment. This tool was used to personalize the economist, as they would be the only ones with access to the machine learning model.
Performance Of Each Model:
Logistic & Linear Regression:
The Linear and Logistic Regression models demonstrated similar behavior; the Linear regression model attained a cross-validated R^2 score of .644, while the Logistic regression model got .633.
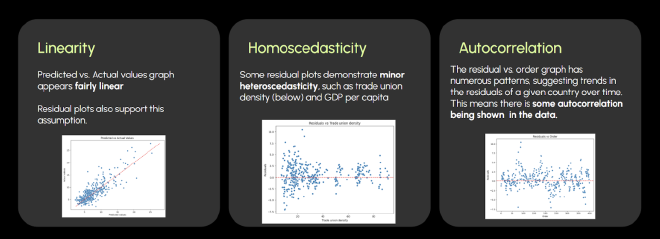
LOGISTIC ASSUMPTIONS:
Deep Neural Network:
- Preprocessing Pipeline
- 7 layers
- ReLu activation function
- Dropout layers
- Predicts Unemployment
- Cross Validated R^2 0.77
DNN ASSUMPTIONS:
We determined that the relationships among the variables were linear, but a few variables demonstrated heteroscedasticity, such as GDP per capita, trade union density(shown above). Furthermore, the residual vs. order plot demonstrated a little autocorrelation within the data.
Our Software Architecture#
Our webapp is split into three distinct Docker containers that are mapped into different folders of our repo. These include our MySQL database, a Flask powered backend, and a Streamlit supported frontend in the app folder. On the Machine Learning side, all of your data cleaning, model training, and cross validation was done in Jupyter Notebooks outside of the app.
When users interact with our site on the frontend, data flows through all sections of our webapp. For example, if a user generates a prediction for a GINI graph, they click a Streamlit button in the frontend app, which sends a POST request through our backend Flask REST API, which uses a predict() Python function developed in Jupyter Notebook. At the same time, the Flask route is also executing a MySQL query to retrieve the model weights from our database. These predictions are then formatted and returned back to our frontend and displayed in a Plotly graph to our user.
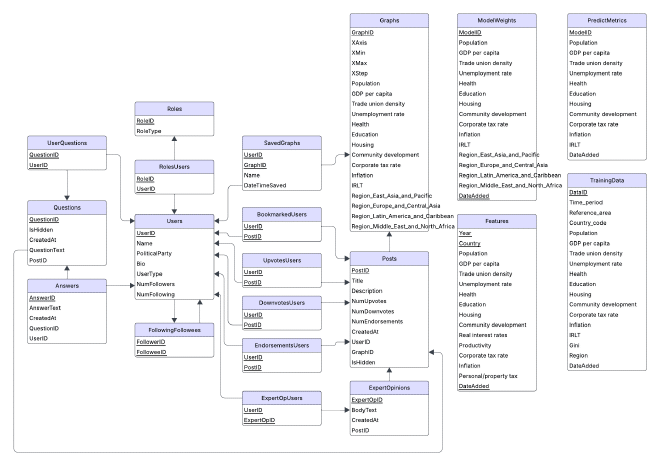
Final Version of Database Model#
While implementing certain features and working with our machine learning model, we realized that we needed to slightly adjust our relational model and DDL. Below are the changes we did, and the final relational model:
- Changed Graphs and ModelWeights entities to incorporate new features and delete irrelevant ones
- Added PredictMetrics entity to aid in normalizing data for predictions
- Added TrainingData entity to be able to retrain regression models in the app itself
- This is an ongoing feature, not added in the MVP
- Added DateAdded value to TrainingData, PredictMetrics and ModelWeight to be able to version our data if new training data needs to be added