Blog Post 3: Deliverable 3#
Executive Summary#
The Phase 2 feedback was extremely helpful—it allowed us to improve certain details of our product by leaps and bounds. Specifically, we implemented new features that lead to more robustly unique user experiences for each persona, adding more sophistication but clearer transparency to the ways in which each persona’s features interact with other persona’s experiences. For example, we decided that economists should have even more access to advanced modeling and inference techniques. They can bring this data into their “expert feedback” within politician’s posts. Furthermore, we improved the DDL for our features and weights tables, adding versioning via a better primary key design. We also made slight changes to our blog, including removing the broken “recent posts” feature and replacing our home image.
Beyond revisions from Phase 2, we also worked hard to turn around a functional MVP for delivery of Phase 3 goals. We poured our attention into constructing a fully functional MVP of the feed and data playground pages, which involved hours of API writing in addition to wiring safety-proof connections to the frontend. On top of this we successfully created, trained, cross-validated, and deployed our first supervised machine learning model (logistic regression), and narrowed in on our plans for the second required real-data-powered model, which will likely be a DNN or MLR targeting unemployment and/or inflation. Overall, phase 3 illuminated many unexpected challenges, which we readily met and addressed with patience and courage. This phase really pushed our product to the next level—our app is starting to take shape and we are excited to continue our path of steady progress.
Revised Product Description:#
Consensus is the “Stack Overflow” of economic policymaking. In a world where policies exist in a black box, Consensus seeks to bring voters, politicians, and economists to the table, where each persona participates in an app experience curated to their needs, perspectives, and level of authority. Politicians make data-backed posts that propose new policies, Economists utilize our powerful data playground to provide expert feedback, and voters voice their opinion with upvotes, downvotes, and question-asking. Consensus enriches all of our users with data literacy and statistically-backed perspectives, yielding democracies that are more data-driven and that more closely represent the will of the people.
Timeline of Updates#
Key Updates:#
- Drastically expanded the individualization of our user persona models
- Created, Trained, Cross Validated, and Deployed our Machine Learning Models
- Built out the APIs and frontend for the Core Functionality of the Product
Full Description#
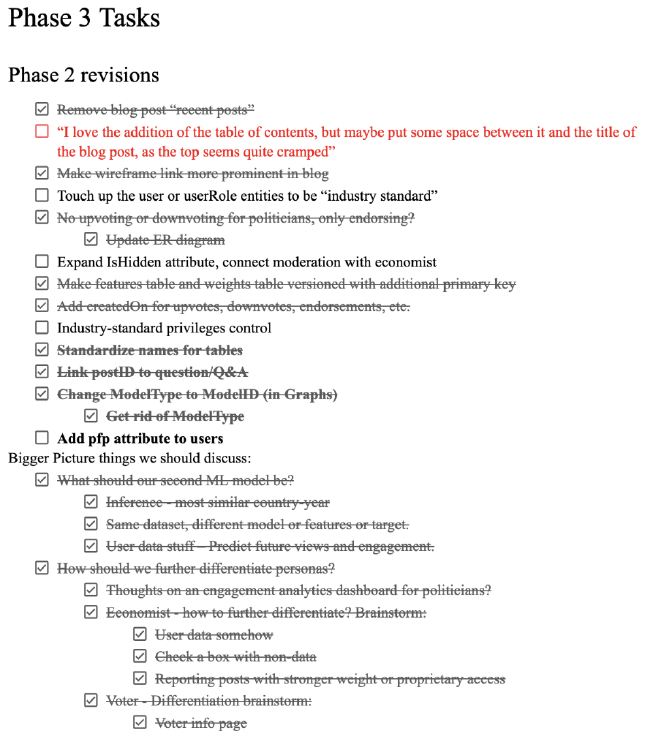
Following Phase 2 feedback, we instantly created a checklist:
Once we felt comfortable working on phase 3 deliverables, those became our main focus.
The DS3000 side consisted of, fixing some of our data collection and processing, and fully completing and deploying our logistic regression model.
The CS3200 side consisted of revising the DDL, inserting mock data, and then creating the API routes.
Throughout all of this both the CS and DS collaborated on bringing our Wireframes to life using Streamlit.
ML Model#
Dataset tweaks from last phase:
We noticed from our phase 2 pair plot that something was suspicious about a lot of the data matching. Sure enough, our data collection function from the world bank was collecting the data from Australia over and over again and assigning that data to each country. That issue was an easy fix.
From phase 2, most of the features of our model remain the same, however upon exploring the data, Costa Rica and Colombia appear to be outliers in the GINI index, so we decided to include regions of the world as a feature to account for these differences. We sourced this data from world bank by downloading a CSV so that we could classify each country to a region and create dummy variables for the regions in the data. (No we didn’t use an API, yes Dr. Gerber said it was okay.)
ML Features:
The features for our machine learning model are primarily government policy numbers and economic indicators that we hypothesized would have some causal connection to the GINI index. Another reason we chose the datasets we chose is because they are plausible indicators that a policymaker would tweak.
The OECD datasets we used include trade union density, combined corporate income tax rate, government spending on education, health, housing and community development as a share of GDP, Long-term interest rates and unemployment. From the world bank we got data on inflation rates, GDP per capita, population, and the GINI index. Exchange rate and GDP data were also collected from the World Bank to derive government spending as a share of GDP, since the original government spending data was in local currency.
Model Results:#
The models work surprisingly well! Our logistic regression model had an R^2 score of .741, or .633 when cross-validated. The linear regression model had an R^2 of .763, or .644 when cross-validated. That being said, there undoubtedly are issues of heteroskedasticity and autocorrelation in the model.
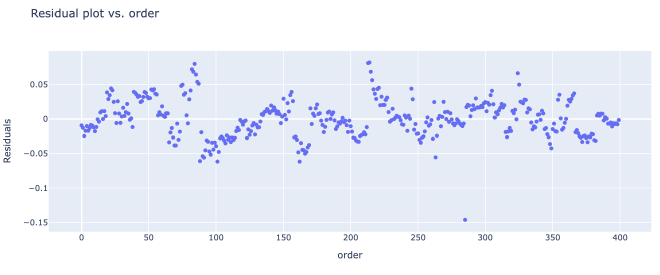
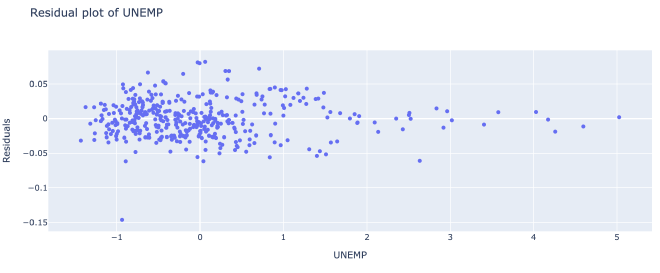
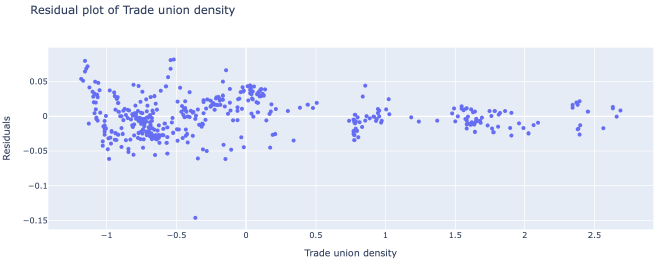
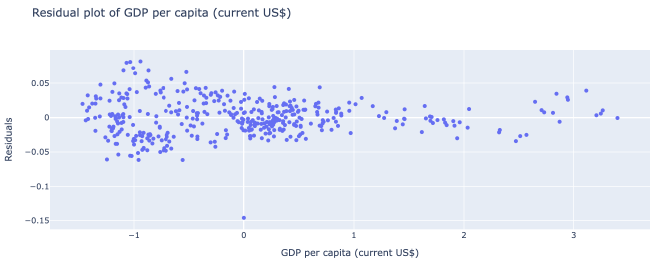
These 3 plots demonstrated the most clear-cut forms of heteroskedasticity in the data. As you can see from the graphs, the variance of the residuals depend on the x feature.
On the bright side, the relationship between the x values and each residual seems fairly linear.
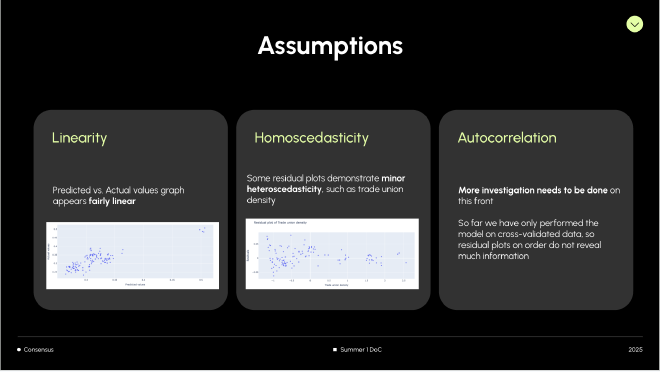
Assumptions:
Databases & REST API#
We’ll keep this bit short - we’re already burnt out from writing APIs :)
Overview#
As we continue to both broaden the scope of our product and simultaneously begin the process of building APIs and Streamlit frontends, we are increasingly narrowing in on exactly the feature set and user experience that we wish to deliver. As our ultimate vision becomes clearer, we’ve revised our diagrams, DDL, and API to reflect this adapting vision.
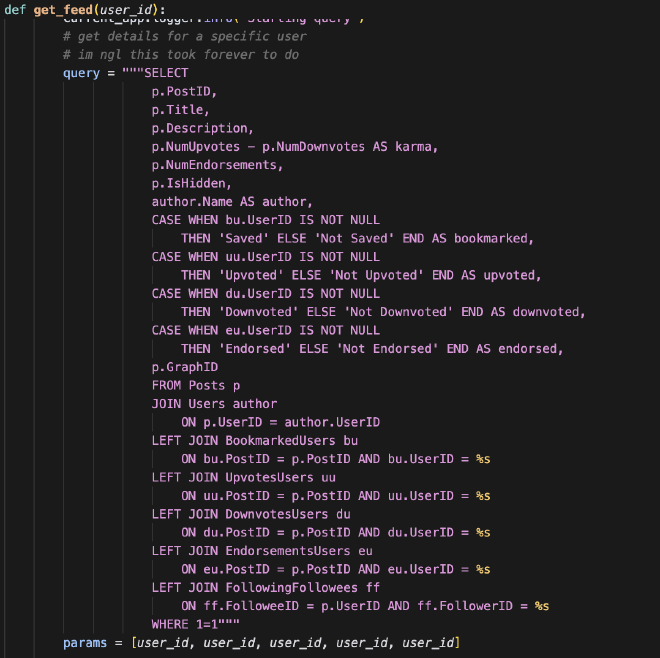
This week was heavily focused on API writing. The Databases team has spent hours designing complicated routes that enable the feed’s functioning. For example, Michael built a GET route titled get_feed, which provides the foundational data to build the user’s feed. See the screenshot below:
Main accomplishments:#
- DDL modifications
- SQL insert statements for fake feed data
- API routes to support feed, upvotes/interactions, data playground, and model predictions
Things we know are broken still:#
- Simultaneously upvoting and downvoting a post
- Role checking for endorsing and up/downvoting
- We don’t have pagination, nevermind infinite scroll, for our feed
- Simple emoji icons are temporary
- Search API parameters don’t work
- Model doesn’t connect in data playground
As we’ve undergone this arduous process, we’ve learned many new things along every step of the journey.
REST API Matrix#
| Resource | GET | PUT | POST | DELETE |
|---|---|---|---|---|
| feed/posts/int:user_id | gets all feed information needed to populate a user’s feed for a particular user | |||
| landing/users/int:user_id | Given user ID, get all user information for session state when needed (primarily the homepage) | |||
| models/posts/predict/int:graphID | Given a graph ID, or the set of features for a graph, returns the predicted gini values. used to populate the posts | |||
| models/playground/predict | Given a body, which is a json of all the features of a graph, returns the predicted gini values | |||
| post_utils/post/int:post_id/upvote/int:user_id | Given a cached user and post ID, upvotes the post by updating numUpvotes for a post and inserts the relevant user and postt ID into the upvotes bridge table | Given a cached user and post ID, unupvotes the post by updating numUpvotes for a post and deletes the relevant user and postt ID in the upvotes bridge table | ||
| post_utils/post/int:post_id/downvote/int:user_id | Given a cached user and post ID, upvotes the post by updating numDownvotes for a post and inserts the relevant user and postt ID into the downvotes bridge table | Given a cached user and post ID, undownvotes the post by updating numUpvotes for a post and deletes the relevant user and postt ID in the downvotes bridge table | ||
| post_utils/post/int:post_id/endorsement/int:user_id | Given a cached user and post ID, endorses the post by updating numEndorsements for a post and inserts the relevant user and postt ID into the endorsements bridge table | Given a cached user and post ID, unendorses the post by updating numEndorsements for a post and deletes the relevant user and postt ID in the endorsements bridge table | ||
| post_utils/post/int:post_id/bookmark/int:user_id | Given a cached user and post ID, bookmarks the post by inserting the relevant user and postt ID into the saved bridge table | Given a cached user and post ID, unbookmarks the post by deleteing the relevant user and postt ID in the saved bridge table |