Phase I - Proposal: Wealth Inequality App#
Project Description#
Problem: Policy papers are frequently black box and inaccesible, often missing voter and data-backed perspectives. Additionally, it is hard to know how economic factors, such as corporate tax rate or government spending, will affect abstract characteristics such as wealth inequality without doing complex analyses or spending a lot of time.
Product: We are building an interactive dicussion-board-like app to bring data literacy in policymaking and economics to the average voter and let politicians and economists reach a wider audience. Our app centers around two components: a social-media-like feed of policy posts, and a data playground that will allow users to see how different metrics affect wealth inequality, or the GINI index. Policy makers/politicians will be able to post policy proposals embedded with machine learning predictions from the data playground, letting them justify how their policies will affect wealth inequality. They will also be able to endorse posts from other politicians that they agree with. Voters will be able to see these posts on a social-media-like feed and interact with them through upvotes, downvotes, or a Q&A section. Additionally, they will be able to play around with the embedded machine learning models in posts by importing them into their own data playgrounds. Economists will have access to a wider suite of machine learning models that can predict metrics besides GINI index, allowing them to give insight on how policies might affect factors besides wealth inequality. They will have their own “Experts Say…” section on posts, allowing them to give expert feedback and information on individual policies. Finally, all users will be able to follow politicians, and be able to filter posts by political affiliation, following, or saved posts.
User Personas#
User Personas: Civilian Voter, Policymaker, and Economist
User Story #1: Civilian Voter#

- Persona: Prince Maximilian William-Lancelot Robertson III
- Demographics:
- Voting citizen of UK
- 30 years old
- Lives in London
- College degree in English
- High school English teacher
- Motivations/behavior:
- Watches the news occasionally, but does not follow politics much due to time constraints with his job
- Is unhappy with the current economic situation in the UK
- Does not read any academic articles or journals
- Browses Reddit, Twitter, and other online websites/social media
- Goals:
- Wants to be more informed about the upcoming election
- Would like to see a fairer redistribution of wealth in new policy
- Does not want to sift through dense policy papers or reports
- Wants an easier way to understand the way politicians will affect economic conditions
- User stories:
- As a civilian voter that lives in the UK, I want a website with information and characteristics that are relevant to me, such as personal tax rate or inflation, so that I can learn about how metrics that everday people interact with affects wealth inequality.
- As a civilian voter, I want a website with straightforward metrics and measures of wealth inequality so that I can learn about how political parties might affect future wealth distribution without keeping up with economic journals and analysts.
- As a civilian voter, I want preset inputs, such as the state of the UK in 2001, so that I can compare current metrics to historical economic data without doing my own research about the history of the economy.
- As a civilian voter, I want to be able to ask questions about policies and their effects so that I can more easily understand policies and more directly reach politicians.
- As a civilian voter, I want to be able to follow politicians so that I can keep up with the policies of polticians that I agree with.
- Demographics:
User Story #2: Policymaker/Politician#

- JT Nance
- Demographics:
- 40 years old
- Works in US federal government
- Lives in DC
- Motivations & Behavior
- Is not a data scientist but understands economics in some capacity
- Likes to explore experimental policy and its consequences
- Interested in how machine learning or AI interprets long-term effects of policy choices
- Prefers practical outputs over theoretical reports
- Goals:
- Wants to better understand the long-term socioeconomic impacts of hypothetical policies
- Interested in scenario analysis: what would happen if the U.S. adopted a Nordic-style tax system? What if corporate tax rates were halved?
- Desires a digestible dashboard to explore economic outcomes without needing deep technical skill
- User stories:
- As a policymaker, I want to input policy scenarios (such as higher capital gains tax, increased minimum wage, etc.) so that I can see potential long-term impacts on income inequality and GDP.
- As a policymaker, I want a tool that explains economic outcomes in plain language and easy-to-understand graphs so that I can quickly summarize insights in briefings and policy memos, while also having the flexibility to go deeper in my explorations
- As a policymaker, I want to be able to post my policies to an everyday audience so that I can easily access voters and get their opinions on policy.
- As a policymaker, I want to be able to save graphs that I create so that I can separately create graphs and posts without spending time doing them both at the same time.
- Demographics:
User Story #3: Economist#
- Emeka Okonkwo
- Demographics:
- 58 years old
- PhD in Economics from Harvard University
- Works in the U.S. Department Of Treasury
- Is often consulted as an advisor
- Nigerian-American
- Sits through extensive briefings and reports/keeps up with economic trends
- Motivations & Behavior
- Wants to close the wealth gap, via equitable economic policies
- Wants to use AI models, to support his goals
- Wants to create visualizations to support his arguments
- Goals:
- Wants to better understand the impact of policy
- Wants to dive extremely deeply into different economic niches, with granular control of the details.
- Seeks to learn about machines’ understanding of economics
- Wants an easier way to understand the way politicians will affect economic conditions
- User stories:
- As an economist, I want to input a wide range of economic variables with granular precision so that I can simulate some different policy scenarios and their effects on the Gini coefficient.
- As an economist, I want to compare predicted Gini coefficients across multiple countries and time periods to identify trends and outliers that inform policy discussions.
- As an economist, I want customizable visualization tools to create detailed graphs that clearly communicate the relationships between variables and wealth inequality to diverse audiences so that
- As an economist, I want to be able to give my expert and academic opinions on policy posts so that I can fact-check politicians and share my informed analyses.
- Demographics:
Models#
Linear Regression: Built from scratch with NumPy, this model will learn from trends to yield a lightweight predictive model that will enable the functioning of our final prediction-based product. While a linear model will have the potential to yield values outside of the GINI range of 0 to 1, it will serve as a solid foundation for future comparison of other predictive models.
Logistic Regression: Though it’s usually used to produce a probability between 0 and 1, we seek to explore if we can use logistic regression to meaningfully predict GINI coefficient (which always lies between 0 and 1).
Clustering: With an automated process to detect the optimal “k”, this model will benefit our users by helping them understand the ways in which countries form into related groups. We can run a clustering algorithm per year for all countries, to examine how fringe countries move between different groups over changing years. This can help identify trends within countries’ economies over time.
Deep Neural Network: We seek to build a lightweight DNN in TensorFlow (or perhaps PyTorch) to test its performance vs. logistic regression.
Data Sources#
Proof of successful API connections#
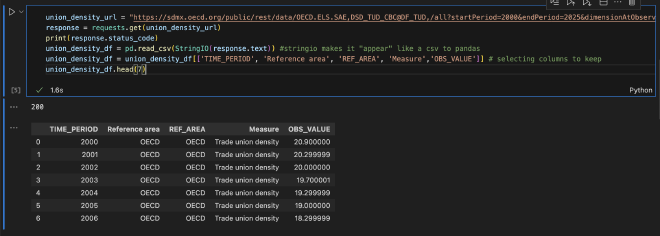
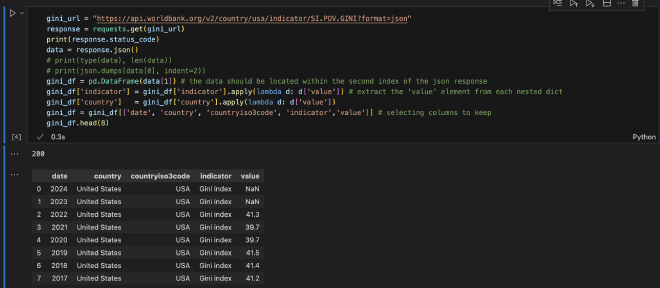
Focusing on data for 2000-2022
Label:
- Gini Coefficient (dev info)
- For the USA (data for 1963-2022):
- For Brazil (data for 1981-2022):
- For UK (data for 1968-2022):
- For Argentina (data for 1991-2022):
- For Germany (data for 1991-2022):
Features:
- Corporate Tax Rate (OECD)
- Trade union density (OECD)
- GDP Per Capita (World Bank)
- Government Expenditure by Function (OECD)
- Population (Worldbank)
- Key Short-term economic indicators (OECD)
- Inflation (World bank)